
Ripple (XRP) Falls to $1.38 After Breaking Below Key $1.40 Support... Market-Wide 'Risk-Off' Sentiment Deepens
On April 29, 2026, XRP fell below the psychological and technical support level of $1.40 to reach $1.38. This decline resulted from dampened investor sentiment caused by Bitcoin's drop and deteriorating technical indicators.
On April 29, 2026, Ripple (XRP) broke below the psychological and technical support level of $1.40, which it had maintained for a long time, falling to the $1.38 level. Accompanied by high trading volume, this decline turned the previous support level into a strong resistance level, raising concerns among market participants about further drops.
The move, accompanied by high trading volume, flipped the support level into resistance, and the price remains at a critical decision stage.
The selling pressure that began on the morning of April 28 resulted in a decline of approximately 0.4% to 0.8% over 24 hours, pushing XRP into the $1.386–$1.39 range. With the $1.40 level, which had held firm throughout April, now broken, the market faces a situation where it must search for a new floor.
Bitcoin's Decline and Market-Wide Pressure
XRP's current decline coincides with Bitcoin being pushed back to the $76,000 level, shifting the overall market into a 'risk-off' mode. As Bitcoin dominance approached 60%, a rotation occurred where funds flowed out of altcoins, creating a decisive obstacle for XRP to defend its price support level.
- Limited demand for altcoins as Bitcoin dominance nears 60%
- Macroeconomic instability due to rumors regarding U.S. stablecoin regulations
- Weakened investor sentiment due to concerns over interest rate hikes
Looking at the price trend in late April, XRP has continued a gradual decline. After closing at $1.434 on April 24, the price dropped to $1.401 on April 27, marking a sharp 2.14% decline, and eventually slumped completely below $1.40 between April 28 and 29.
Technical indicators also support a pessimistic outlook. Currently, the 50-day and 200-day moving averages are positioned above the price, forming a 'Death Cross,' which is typically interpreted as a signal that downward pressure will persist.
As recently as April 21, when the MACD (Moving Average Convergence Divergence) turned bullish and ended a 90-day sell signal, there were expectations for a rebound targeting $1.80. However, as the multi-month triangle pattern resolved to the downside rather than the upside, the technical breakout attempt ended in failure.
'Underwater' Resistance Wall and Investor Sentiment
Analysis suggests that approximately 60% of the circulating XRP supply is held at an average purchase price near $1.44. Consequently, an 'underwater' resistance wall is formed whenever the price enters the $1.40–$1.45 range, as selling volume from investors looking to break even pours in, blocking any upward movement.
However, this price drop appears to be driven by overall market trends rather than Ripple's fundamentals or legal issues. Since the conclusion of the lawsuit with the SEC in 2025, the Ripple ecosystem has entered a 'Post-Resolution' era, focusing on the launch of the RLUSD stablecoin and securing regulatory clarity, and continues to operate stably.
Regarding the future outlook, experts have set the immediate target for the bears (sellers) at $1.36. If the current selling pressure continues and $1.36 is breached, there is a risk of further decline toward the $1.00 level in the long term, requiring caution from investors.
| Date | Open | Close | Change (%) |
|---|---|---|---|
| April 24, 2026 | $1.439 | $1.434 | -0.37% |
| April 25, 2026 | $1.434 | $1.424 | -0.66% |
| April 26, 2026 | $1.424 | $1.432 | +0.52% |
| April 27, 2026 | $1.432 | $1.401 | -2.14% |
| April 28, 2026 | $1.401 | $1.392 | -0.64% |
Daily closing prices and percentage changes leading to the $1.40 breach.
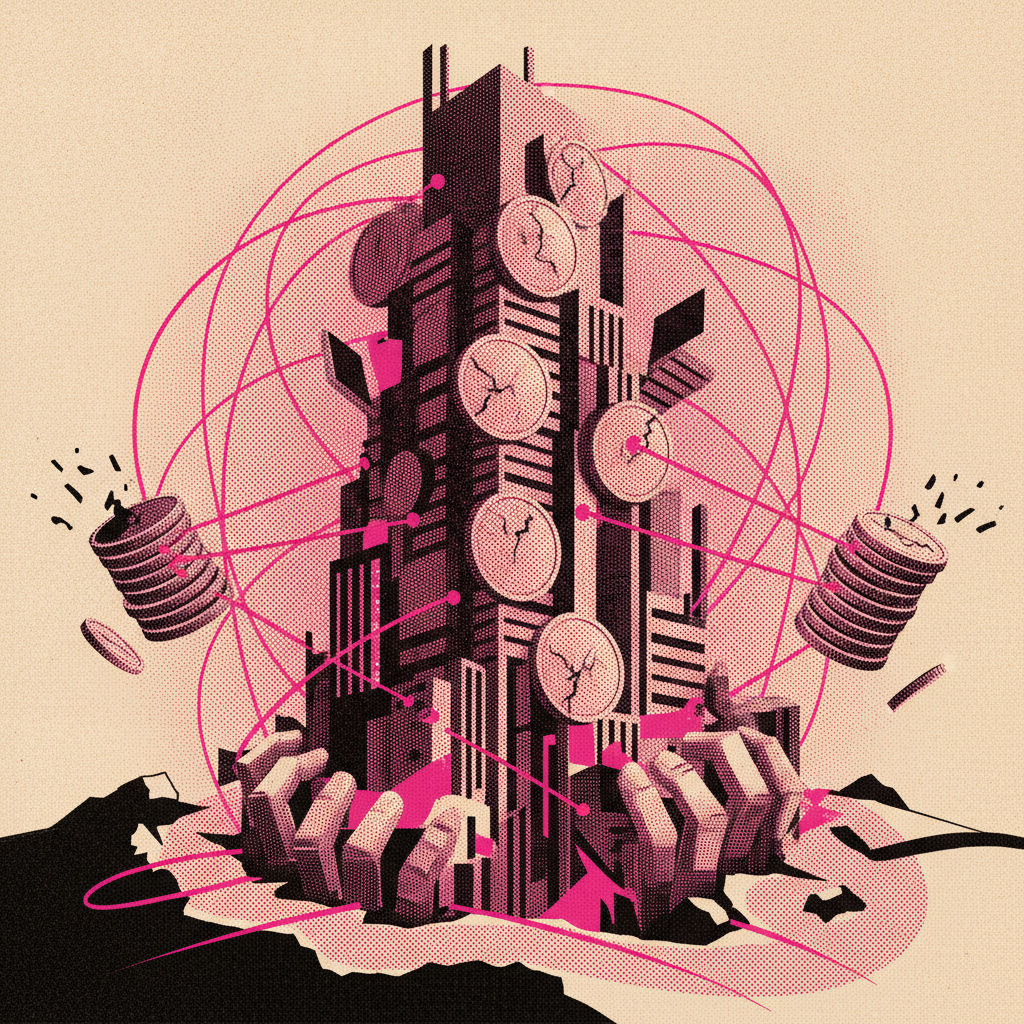
Visualizing the breakdown of the $1.40 support level.


This content is for information and commentary only and is not investment advice.
Join the reader conversation
Read reactions to this article and leave your own note.